How we reduced the memory usage of our Rust extension by 4x
What is Kolo?
Kolo is a dynamic code analysis tool for Python. We use Python's sys.setprofile to introspect Python's call stack and local variables. For performance reasons, Kolo is partially implemented in Rust using the excellent PyO3 crate.
The bug report
Recently, we received a report of Kolo running out of memory when analysing an unusually large Django view. To get an idea of what was causing it, I created a very simple python script that would generate a lot of python frames:
from kolo import enable


def fibonnaci(n):
    if n == 0:
        return 0
    if n == 1:
        return 1
    return fibonnaci(n - 1) + fibonnaci(n - 2)


def profile_fibonnaci(n):
    with enable({"use_rust": True):
        print(fibonnaci(n))


if __name__ == "__main__":
    import sys

    n = int(sys.argv[1])
    profile_fibonnaci(n)
By scaling up which fibonacci number to calculate, I was able to observe very high memory usage in the Rust extension. After confirming that the reporter also only saw the issue when use_rust was set to True, I dug in.
Valgrind
To understand the memory usage I first turned to valgrind, as recommended by the pyo3 documentation. I downloaded a suppressions file for Python and tried running my test script:
$ valgrind --suppressions=valgrind-python.supp python big_trace.py 15
==196497== Memcheck, a memory error detector
==196497== Copyright (C) 2002-2017, and GNU GPL'd, by Julian Seward et al.
==196497== Using Valgrind-3.18.1 and LibVEX; rerun with -h for copyright info
==196497== Command: python big_trace.py 15
==196497==
610
==196497==
==196497== HEAP SUMMARY:
==196497==     in use at exit: 12,390,108 bytes in 122,153 blocks
==196497==   total heap usage: 471,170 allocs, 349,017 frees, 106,233,282 bytes allocated
==196497==
==196497== LEAK SUMMARY:
==196497==    definitely lost: 24 bytes in 1 blocks
==196497==    indirectly lost: 0 bytes in 0 blocks
==196497==      possibly lost: 940,514 bytes in 9,878 blocks
==196497==    still reachable: 11,449,570 bytes in 112,274 blocks
==196497==         suppressed: 0 bytes in 0 blocks
==196497== Rerun with --leak-check=full to see details of leaked memory
==196497==
==196497== For lists of detected and suppressed errors, rerun with: -s
==196497== ERROR SUMMARY: 0 errors from 0 contexts (suppressed: 0 from 0)
Unfortunately I didn't find the output easy to understand at first. After more reading and running with different configurations, I realised that I didn't have a memory leak per se. Instead I was using a lot of memory, which was then cleaned up properly when no longer needed. Specifically, although there is maybe a 12MB leak ("in use at exit"), this is just a fraction of the total 106MB allocated ("total heap usage").
Heaptrack
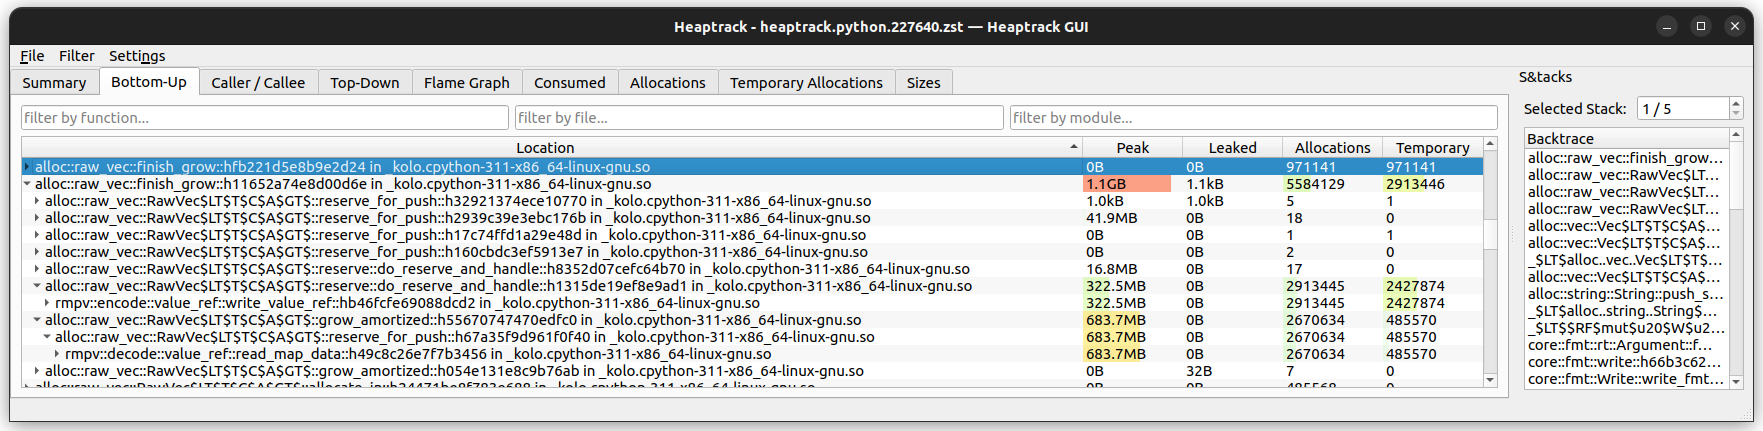
I next turned to the heaptrack memory profiler, and this was much more useful.
$ sudo apt install heaptrack heaptrack-gui

$ heaptrack python big_trace.py 25
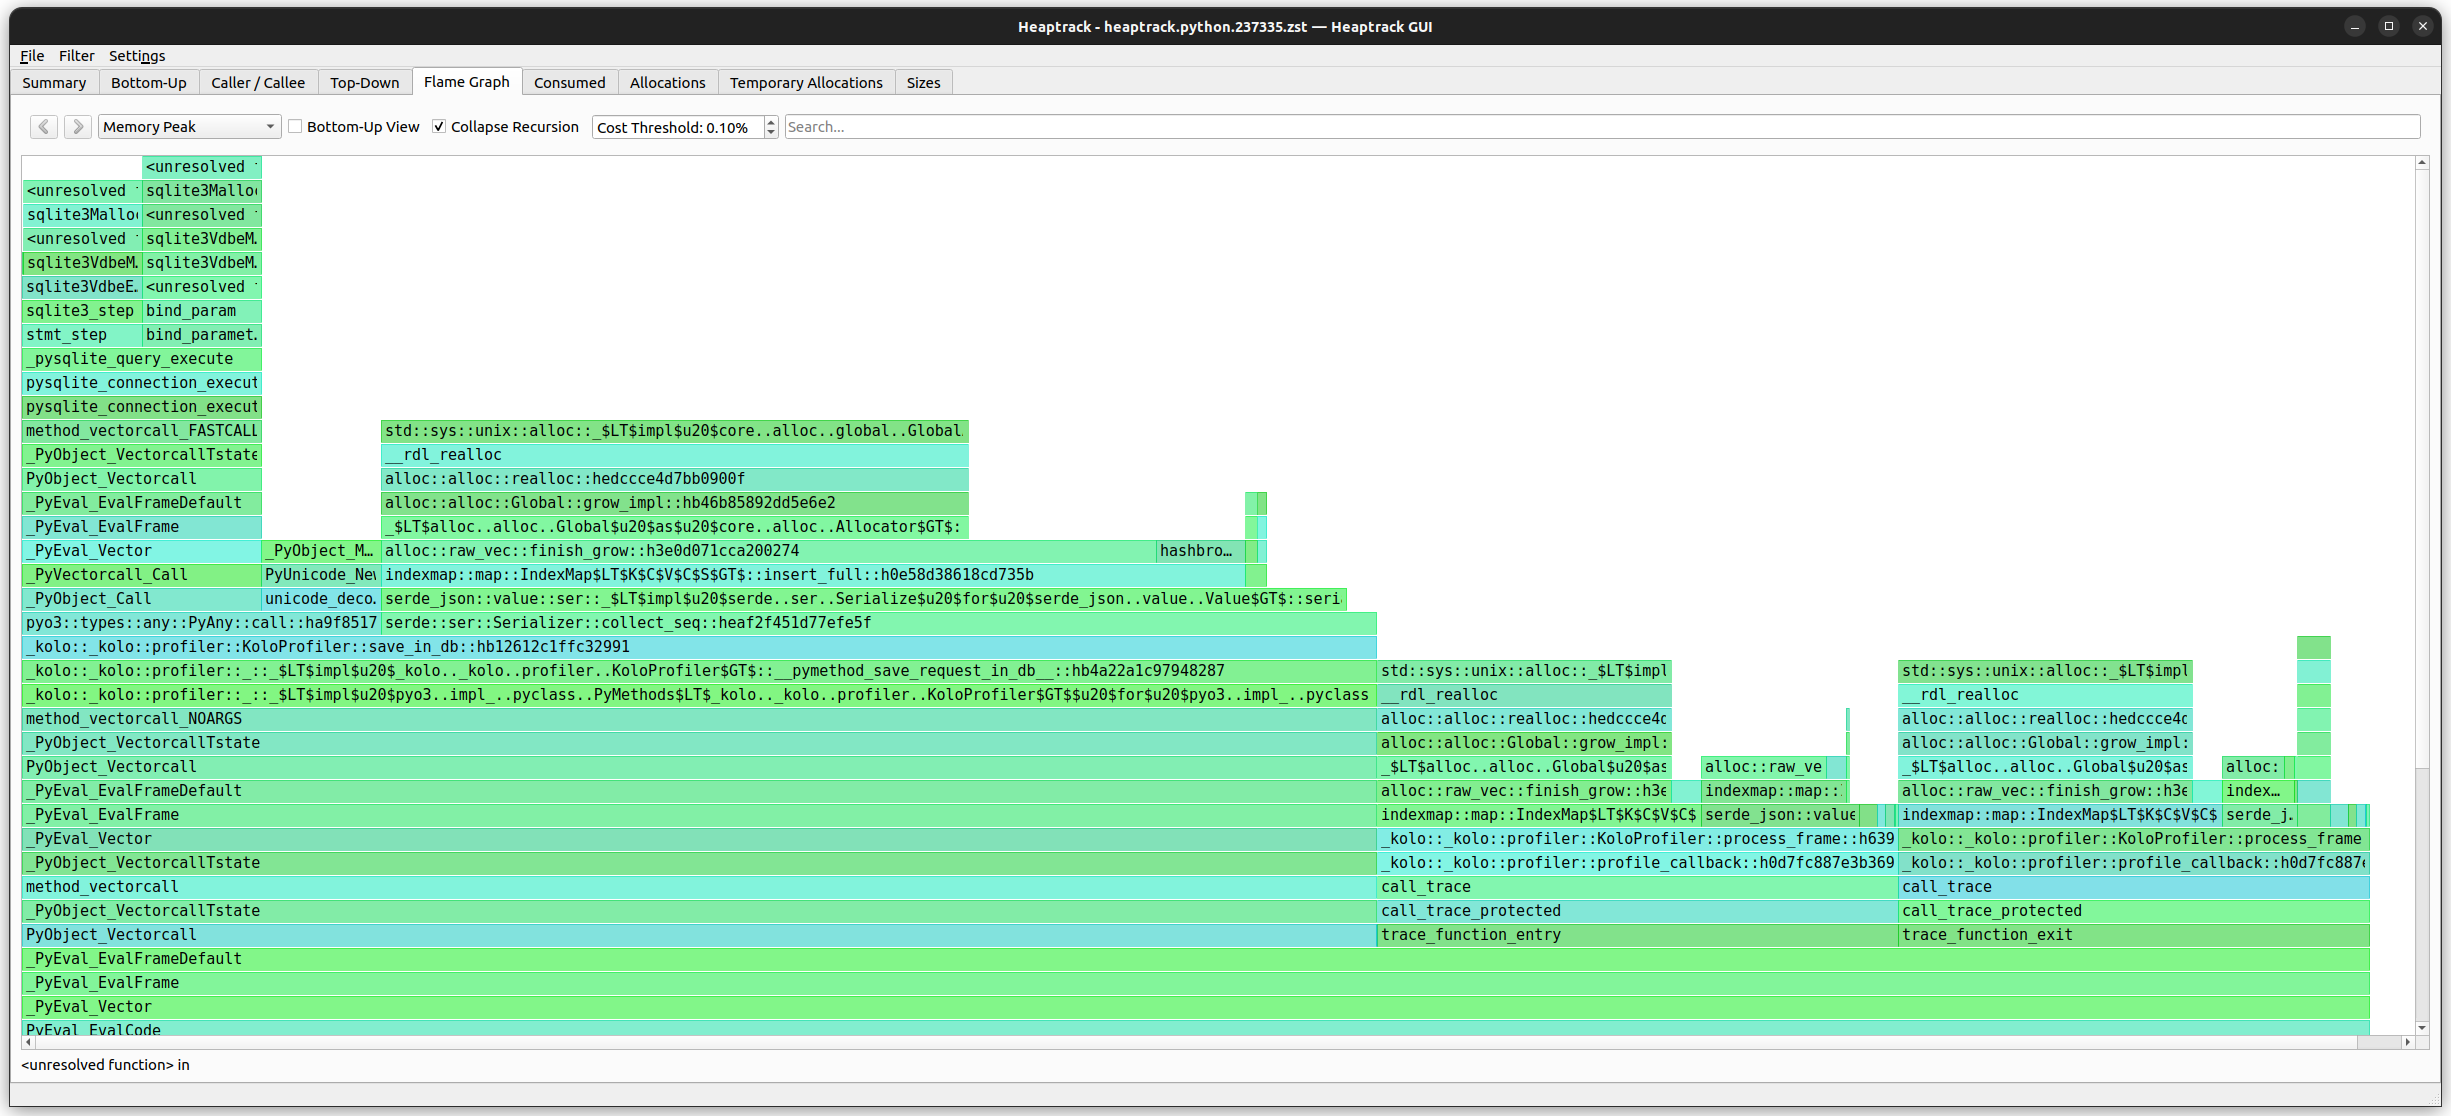
As can been seen, about 60% of the memory is being used in _kolo::_kolo::profiler::KoloProfiler::save_in_db and the other 40% in _kolo::_kolo::profiler::KoloProfiler::process_frame.
Lets first look at a simplified version of save_in_db:
    fn save_in_db(&self, py: Python) -> Result<(), PyErr> {
        // prepare other data to save

        let mut state = self.frames_of_interest.lock().unwrap();
        let frames_of_interest = std::mem::take(&mut *state);

        let data = json!({
            "frames_of_interest": frames_of_interest,
        });
        let db = PyModule::import(py, "kolo.db")?;
        let save = db.getattr(intern!(py, "save_invocation_in_sqlite"))?;
        save.call1((&self.db_path, data.to_string()))?;
        Ok(())
    }
frames_of_interest is a Vec<serde_json::Value>, which we convert into a string then call back into Python to save it to Kolo's sqlite3 database.
Looking at process_frame, we see the other side of the process, where we create the serde_json::Value items and push them into self.frames_of_interest:
    fn process_frame(
        &self,
        frame: PyObject,
        event: &str,
        arg: PyObject,
        py: Python,
    ) -> Result<(), PyErr> {
        // omitted getting data from various sources

        let frame_data = json!({
            "path": path,
            "co_name": name,
            "qualname": qualname,
            "event": event,
            "frame_id": self._frame_ids.get_or_default().borrow().get(&pyframe_id).cloned(),
            "arg": utils::dump_json(py, arg)?,
            "locals": json_locals,
            "thread": thread_name,
            "thread_native_id": native_id,
            "timestamp": utils::timestamp(),
            "type": "frame",
            "user_code_call_site": user_code_call_site,
        });

        self.push_frame_data(py, frame_data)
    }
Ijson
Having realised that we were spending a lot of memory storing serde_json::Value, I looked into the ijson crate which aims to optimise the memory usage of json.
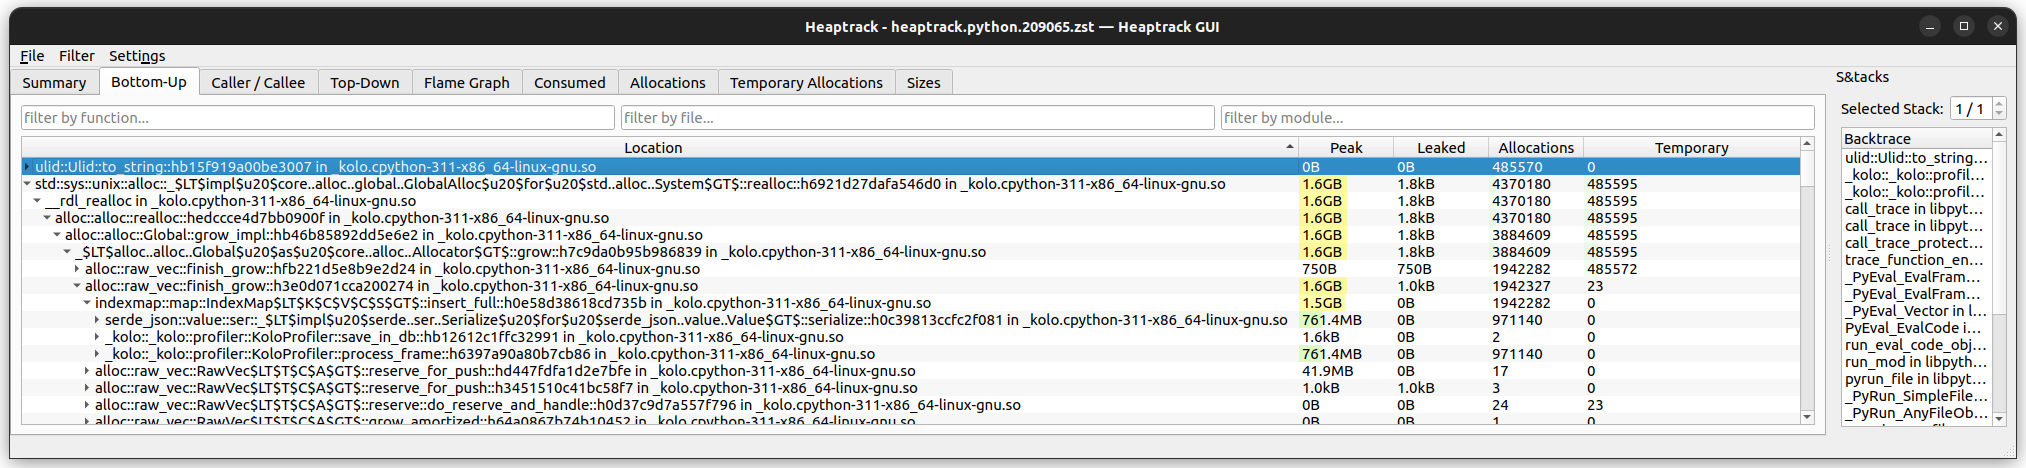
By changing each usage of serde_json::Value to ijson::IValue and the json! macro to the ijson! macro, I was indeed able to cut the Rust memory usage in half. Before we were using 1.6GB (for fibonacci(25)):
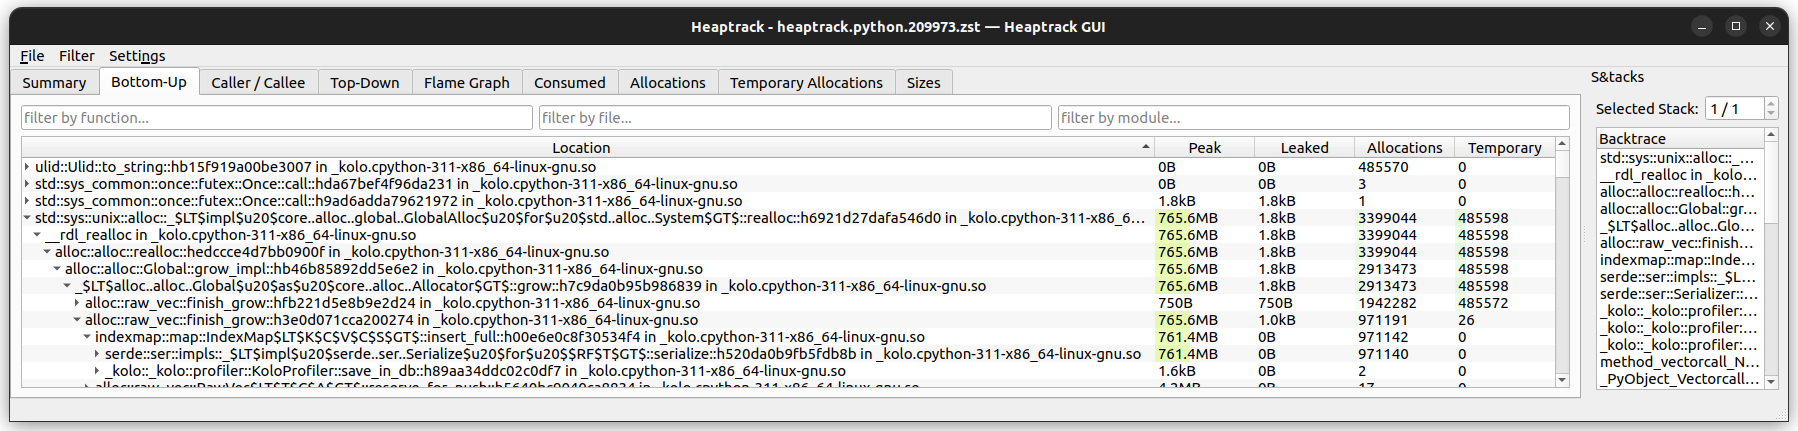
With ijson, we use 765MB:
This was a really nice win! Unfortunately, our test suite failed when trying to serialize an arbitrary sized integer. Both Python's json and Rust's serde_json support this. In serde_json's case this requires the arbitrary_precision feature), which is incompatible with ijson.
Rethinking things
Faced with a choice between dropping compatibility for a supported data type or not improving the memory situation, I decided to take a step back. In Kolo we use json because it's a simple format which is widely supported. However, it has a number of drawbacks which are starting to hurt:
- As a text-based format it's not especially compact.
- It only has support for a limited number of types, which don't match Python's data types amazingly well.
Maybe it was time to try a different format. In particular, msgpack was looking attractive:
- It is a binary format which optimises for size.
- It supports many of the basic types we want to support.
- It has an extension mechanism we can use to implement the missing bits of Python's data model we care about.
After implementing a proof of concept in the Python side of Kolo, it was time to see how it fared in Rust:
    fn save_in_db(&self, py: Python) -> Result<(), PyErr> {
        let mut state = self.frames_of_interest.lock().unwrap();
        let frames_of_interest = std::mem::take(&mut *state);

        let data = if self.use_msgpack {
            let frames_of_interest: Vec<rmpv::Value> = frames_of_interest
                .iter()
                .map(|s| match s {
                    SerializedFrame::Msgpack(v) => v.clone(),
                    _ => {
                        unreachable!("frames_of_interest was not all msgpack")
                    }
                })
                .collect();
            };
            let data = rmpv::Value::Map(vec![
                ("frames_of_interest".into(), frames_of_interest.into()),
            ]);

            let mut buf: Vec<u8> = vec![];
            rmpv::encode::write_value(&mut buf, &data).unwrap();
            PyBytes::new(py, &buf).into()
        } else {
            // handle json
        };

        let db = PyModule::import(py, "kolo.db")?;
        let save = db.getattr(intern!(py, "save_invocation_in_sqlite"))?;
        save.call1((&self.db_path, data))?;
        Ok(())
    }

    fn process_frame(
        &self,
        frame: PyObject,
        event: &str,
        arg: PyObject,
        py: Python,
    ) -> Result<(), PyErr> {
        // omitted getting data from various sources

        let data = if self.use_msgpack {
            let frame_data = rmpv::Value::Map(vec![
                ("path".into(), path.into()),
                ("co_name".into(), name.into()),
                ("qualname".into(), qualname),
                ("event".into(), event.into()),
                ("frame_id".into(), frame_id),
                ("arg".into(), arg),
                ("locals".into(), locals),
                ("thread".into(), thread_name.into()),
                ("thread_native_id".into(), native_id.into()),
                ("timestamp".into(), utils::timestamp().into()),
                ("type".into(), "frame".into()),
                ("user_code_call_site".into(), user_code_call_site),
            ]);
            SerializedFrame::Msgpack(frame_data)
        } else {
            // handle json
        };

        self.push_frame_data(py, data)
    }
Here we use the rmpv crate, which provides a Value similar to serde_json's. Unfortunately it doesn't have an equivalent for the json! macro, so we use the more verbose rmpv::Value::Map interface, which involves a lot of .into() calls to massage the data.
I also introduced the SerializedFrame enum allowing us to support both formats for a while.
This worked, but we're still using a lot of memory:
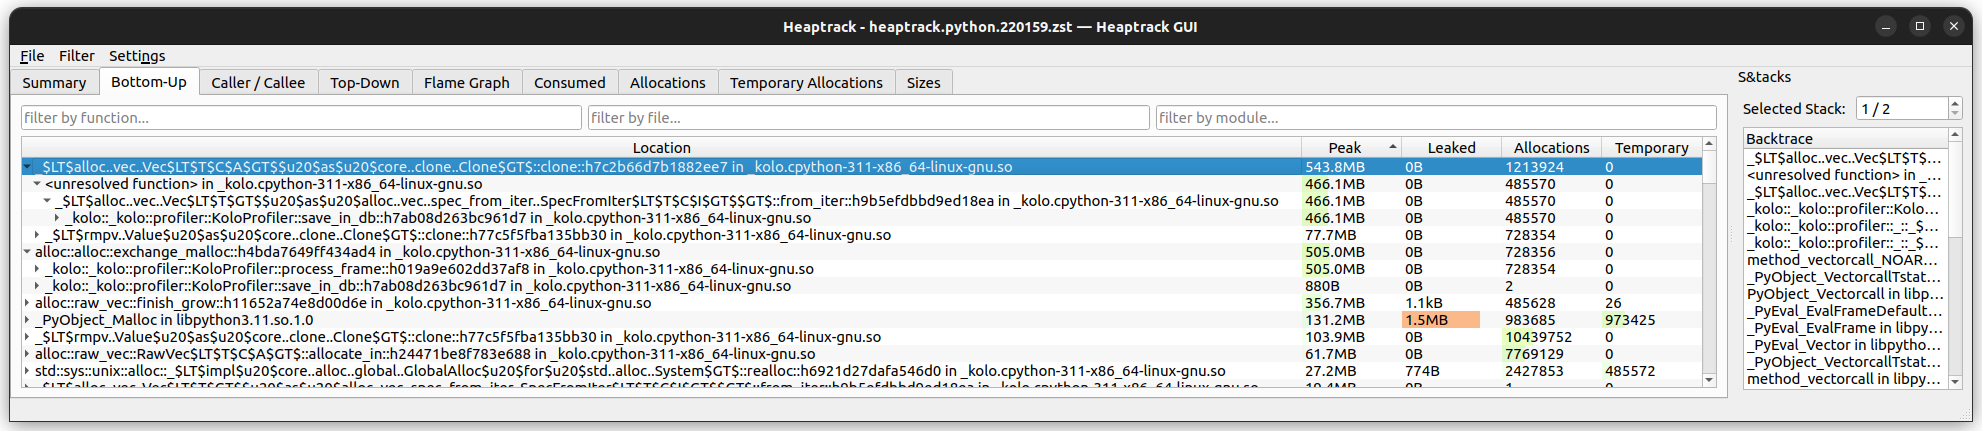
The call to .clone() when unpacking the frames_of_interest is suspicious:
            let frames_of_interest: Vec<rmpv::Value> = frames_of_interest
                .iter()
                .map(|s| match s {
                    SerializedFrame::Msgpack(v) => v.clone(),  // Suspicious!
                    _ => {
                        unreachable!("frames_of_interest was not all msgpack")
                    }
                })
                .collect();
            };
We're taking each rmpv::Value from frames_of_interest and copying it! No wonder we're using so much memory. Let's try using rmpv::ValueRef instead. This works with a reference to the data, instead of owning the value:
            let frames_of_interest: Vec<rmpv::ValueRef> = frames_of_interest
                .iter()
                .map(|s| match s {
                    SerializedFrame::Msgpack(v) => utils::load_py_msgpack(v),
                    _ => {
                        unreachable!("frames_of_interest was not all msgpack")
                    }
                })
                .collect::<Result<Vec<rmpv::ValueRef>, PyErr>>()?;
To make this work we also update process_frame and add load_py_msgpack:
    fn process_frame(
        &self,
        frame: PyObject,
        event: &str,
        arg: PyObject,
        py: Python,
    ) -> Result<(), PyErr> {
        let data = if self.use_msgpack {
            let frame_data = rmpv::ValueRef::Map(vec![
                ("path".into(), path.as_ref()),
                ("co_name".into(), name.as_ref()),
                ("qualname".into(), qualname.as_ref()),
                ("event".into(), event.into()),
                ("frame_id".into(), frame_id.as_ref()),
                ("arg".into(), arg),
                ("locals".into(), locals),
                ("thread".into(), thread_name.into()),
                ("thread_native_id".into(), native_id.into()),
                ("timestamp".into(), utils::timestamp().into()),
                ("type".into(), "frame".into()),
                ("user_code_call_site".into(), user_code_call_site.as_ref()),
            ]);
            let mut buf: Vec<u8> = vec![];
            rmpv::encode::write_value_ref(&mut buf, &frame_data).unwrap();
            SerializedFrame::Msgpack(buf)
        } else {
            // json
        };

        self.push_frame_data(py, data)
    }

pub fn load_py_msgpack(raw_data: &[u8]) -> Result<rmpv::ValueRef, PyErr> {
    let mut data = std::io::Cursor::new(raw_data);
    let data = match rmpv::decode::value_ref::read_value_ref(&mut data) {
        Ok(value) => value,
        Err(err) => {
            // Error handling
        }
    };
    Ok(data)
}
Now we're storing the raw msgpack data in the SerializedFrame::Msgpack variant as a Vec<u8> and using ValueRef we save about 200MB, but we're doing a lot of encoding and decoding in ValueRef:
The elephant in the room
All of the approaches I've tried up to now have been encoding json or msgpack data in process_frame and then decoding it again either in process_frame or save_in_db before re-encoding it in save_in_db. But we don't modify that data after the decode step, so it would be great if we could skip this extra decode/encode step.
To do this, I realised I should drop down to the lower level rmp crate, which allows writing data directly to a buffer:
    fn save_in_db(&self, py: Python) -> Result<(), PyErr> {
        let mut state = self.frames_of_interest.lock().unwrap();
        let frames_of_interest = std::mem::take(&mut *state);
        let data = if self.use_msgpack {
            let trace_id = self.trace_id.lock().unwrap().clone();
            let mut buf: Vec<u8> = vec![];

            rmp::encode::write_map_len(&mut buf, 1).unwrap();
            rmp::encode::write_str(buf, "frames_of_interest").unwrap();
            rmp::encode::write_array_len(buf, frames_of_interest.len() as u32).unwrap();
            buf.append(
                &mut frames_of_interest
                    .into_iter()
                    .flat_map(|s| match s {
                        SerializedFrame::Msgpack(v) => v,
                        _ => unreachable!(),
                    })
                    .collect(),
            );

            PyBytes::new(py, &buf).into()
        } else {
            // json
        };
        let db = PyModule::import(py, "kolo.db")?;
        let save = db.getattr(intern!(py, "save_invocation_in_sqlite"))?;
        save.call1((&self.db_path, data))?;
        Ok(())
    }
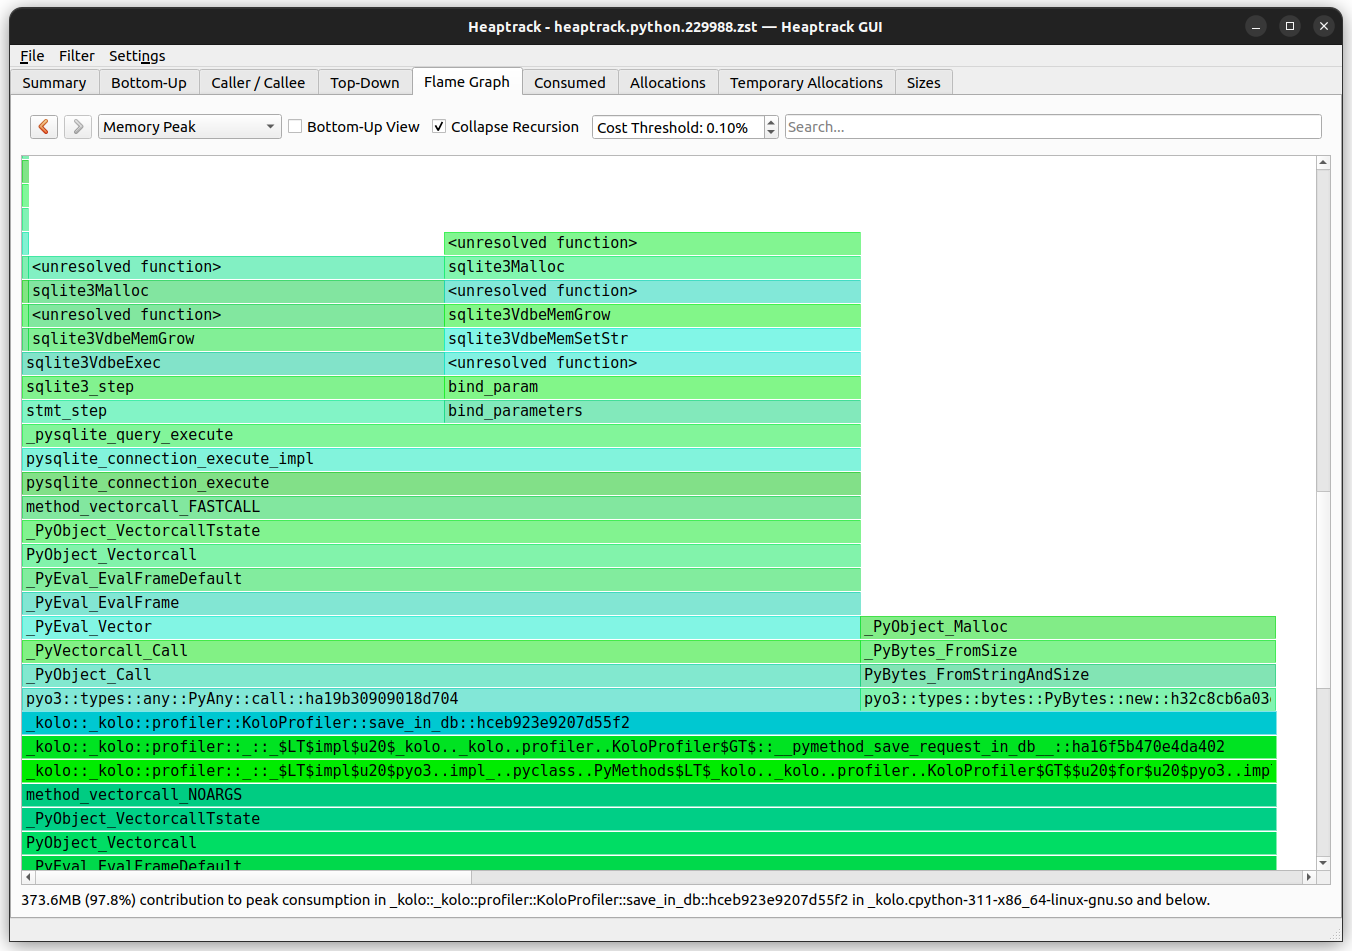
We use the write_ functions to add each part of the msgpack protocol to the buffer in order, then finally push all the already encoded data in frames_of_interest into the buffer.
With this refactor, memory usage has dropped under 400MB, process_frame has disappeared from the memory profile and peak memory usage now comes from the Python code saving the trace to sqlite3.
Conclusions
When I started looking into this bug, I had no idea how far it would take me. While I had heard of valgrind, I'd never tried to use it before. Heaptrack was completely new to me, but was invaluable in helping me understand the problem. I learned about the clever ijson crate and, while it wasn't right for us this time, I'm glad to have it available.
I'm very happy to have finally taken the time to look into msgpack. I'm excited about using extension types to provide richer type information to users of Kolo in the future. And I'm thankful to have significantly reduced the memory overhead of Kolo by taking full advantage of the rmp and rmpv crates.